
US CPI: The inflation test that could move markets


The US CPI 2026 report and Fed Chair Warsh's testimony could become the defining events for Fed interest rates news this month. Here's what markets are pricing in, the key scenarios to watch, and how inflation data could impact gold, the US dollar, Treasury yields and equities.
After a weaker-than-expected jobs report and a fresh geopolitical escalation in the Persian Gulf, markets enter Tuesday's US CPI release with hawkish Fed expectations already priced in. The situation, however, is not defined yet as markets wobble between the “sticky inflation” narrative and possible economic slowdown.
The June inflation print, along with Fed Chair Warsh's testimony just 90 minutes later, may clarify interest rate expectations for the rest of the year.
Last week left the markets in an uneasy balance. The weak NFP report pushed rate-hike expectations lower, but the US–Iran escalation sent oil close to $79 per barrel, and probabilities of a more hawkish Fed have increased. However, volatility metrics haven’t changed: VIX remained near its lows, and the fear-and-greed index sits in the neutral zone.
Therefore, the US CPI publication would be the most important test of the month.
The event: On Tuesday, July 14, at 12:30 GMT, the US will publish the June CPI report — followed at 14:00 GMT by Fed Chair Warsh's testimony. In this article, let's examine what markets have priced in, why this particular release matters more than usual, and how key instruments may react under different scenarios.
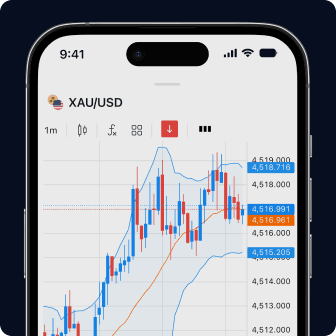
Every tool you need, all in one place
Chart, trade, and manage your funds—all from one user-friendly screen.
Key takeaways
- The US CPI 2026 report could reshape Fed policy expectations. Markets are evenly split on the next interest rate move, making the inflation release a key driver of Fed news.
- Fed Chair Warsh's testimony adds to market volatility. His remarks shortly after the CPI release could reinforce or challenge the market's interpretation of the inflation data.
- Oil prices raise inflation risks beyond the current report. While the latest energy surge is not yet reflected in the data, investors may price in higher inflation and tighter Fed interest rates ahead.
- Gold, the dollar and Treasury yields are set for sharp moves. The outcome of the US CPI 2026 release will likely determine the near-term direction of major financial markets.
- Gold offers one of the clearest trading setups. A softer inflation reading could weaken hawkish Fed interest rates expectations and trigger a bullish breakout in XAUUSD.
Markets have moved from pricing rate cuts to pricing a possible hike: CME FedWatch currently shows roughly a 50% probability of a hike in September.
The June CPI print will be released on the same day as Fed Chair Warsh's testimony, doubling the event risk within a two-hour window. The new Fed chair's policy, which involves no public forecasts, increases uncertainty and gives more room for speculation.
July's oil spike is not yet in the June data — but a strong CPI print would make the market extrapolate energy-driven inflation into the second half of the year.
Why the US CPI 2026 report matters more than usual
The policy narrative has already shifted twice within two weeks.
The weaker-than-expected NFP report (57k new jobs, which was less than expected) briefly raised hopes that interest rates would remain unchanged (near-term cuts were off the table yet) followed an earlier period in which a strong NFP changed the market narrative, highlighting just how quickly expectations around Fed policy can shift. The June FOMC minutes revealed a deeply divided Committee, with a few officials already seeing a case for raising rates in June. That points to increased uncertainty for all global markets.
In other words, the Fed itself is split, and the market is in the “standby mode” waiting for new information to establish the dominant market narrative. September hike odds hover around 50% — essentially a coin flip. That is exactly the setup in which a single data point can move the whole rates curve: there is no firm consensus to lean on, so the CPI print becomes the tiebreaker.
Adding to the tension, Fed Chair Warsh testifies at 14:00 GMT — just 90 minutes after the release. Markets will not only trade the number itself but also its immediate interpretation by the Fed Chair. A hot print followed by hawkish remarks would be a compounding effect rather than two separate events.
Currently, the consensus forecast for US core inflation rate is 2.9%, which means no changes compared to the previous publication.

Why oil prices could keep Fed interest rates higher
An important clue: the June CPI report will not yet capture July's oil spike, when Brent surged nearly 5% to around $78 per barrel and pressed toward $79 amid the US–Iran fire exchanges. That inflationary impulse will only show up in the July data, published in August.
However, markets are forward-looking. As discussed in our analysis of oil and gas in 2026, July's oil spike has the potential to influence inflation expectations well before it appears in official CPI data. And typically price in future information for several months ahead, and further. Therefore, sticky services inflation, plus a fresh energy impulse, plus US Strategic Petroleum Reserve stocks at their lowest level since 1983, is a combination that pushes the Fed to maintain a hawkish stance.
Conversely, a soft June print would give the 'transitory energy spike' camp an argument: if underlying inflation was cooling before the escalation, the Fed can afford to look through a geopolitically-driven oil move — as long as it does not persist.
How traders are positioned ahead of the US CPI release
The current positioning looks like a fragile equilibrium.
As discussed in our recent analysis of gold prices in 2026, gold found support near the $4,040 area after falling to a one-week low near $4,056 and is now consolidating inside a triangle ahead of the CPI release, reacting neutrally to external triggers. Notably, there is a seasonal tendency for gold to strengthen from mid-July — and the CPI release may become the trigger that resolves the consolidation.
Crude oil has stabilized in a range after the escalation-driven surge, with a natural gravity toward its 200-day moving average around $76 as part of regular mean-reversion activity.
Equities remain in rotation mode rather than a full exit: capital has been moving from overheated AI momentum names into healthcare, financials and energy-related themes. The indices stabilized after Friday's sell-off, but breadth remains narrow.
Treasury yields remain near 4.57% on the 10-year Treasury, with the long end drifting higher, as the ”bear steepening” narrative is still on.
Scenario 1: Hot CPI strengthens the hawkish Fed case
If both headline and core CPI come in above expectations, September hike odds move decisively above 50%, and the year-end hike becomes the base case rather than a risk scenario.
The likely chain reaction: Treasury yields jump (supposedly, on the long end of the curve), the dollar strengthens, and Gold may slide back to the $4,000 psychological area, despite the supportive seasonal factor.
A hawkish tone from Warsh's testimony on top of a strong print would strengthen the bearish combination for risk assets this week.
Scenario 2: Inflation meets expectations, markets stay rangebound
If the CPI comes aligned with the consensus, but the Fed does not deliver a particularly hawkish message to the markets, gold and DXY may keep consolidating inside of their ranges, with oil getting back to $76, and equities rotating without any directional breaks.
This is the most probable scenario, but also the least stable one: uncertainty will remain high, and price action will remain unstable.
Scenario 3: Soft CPI weakens the hawkish Fed narrative
A downside surprise would give relief for bond markets and gold. Expectations for further rate hikes would fade. Yields and the dollar would pull back, and the assets that suffered most from the repricing would bounce the hardest.
Gold looks best positioned for this scenario: it shows relative strength holding well above the $4,040, seasonality turns favorable from mid-July, and a soft CPI could trigger an upside breakout from the triangle.
Nasdaq and semiconductors may or may not initiate a relief rally, as they seem to be a bit overheated from different metrics.
Markets to watch after the US CPI release
The key market to watch is XAUUSD. The triangle consolidation above $4,040 presents an interesting technical setup that may precede the trending move. If the CPI comes in softer than expected, the upside breakout for Gold is expected. But the baseline scenario would be the continuation of consolidation with sporadic false breakouts to both sides without prolonged continuation.

Key economic events this week (13–17 July)
- Tuesday, July 14, 12:30 GMT: US CPI (June 2026) — key inflation publication.
- Tuesday, July 14, 14:00 GMT: Fed Chair Warsh testimony.
- Wednesday, July 15, 12:30 GMT: US PPI (June 2026).
- Friday, July 17, 14:00 GMT: Michigan consumer sentiment index.
Risk management made simple
Set take profit and stop loss by price, money, pips, or a percentage of equity.
Final thoughts: The US CPI could decide the Fed's next move
The US CPI for June 2026 might provide greater clarity on the Fed's policy outlook, as the recent equilibrium in expectations leaves room for different narratives to be promoted. With September hike odds sitting near 50%, the June inflation print, amplified by Warsh's testimony, will likely set the direction for yields, the dollar, and risk assets for the rest of the month.
Disclaimer: This content is for informational purposes only and should not be considered investment or trading advice. Always conduct your own research before making financial decisions.
Share:
Related


Exness Trade app
Trade with confidence anytime, anywhere.


Get the app
App title

Trading is risky. T&Cs apply.
More in Deep dives


